Our researcher Cara blogs in response to the massive interest in Cambridge Assessment research which showed volatility in schools’ GCSE exam results is normal, quantifiable and predictable.
Last week we published a
new research report showing that most of the volatility in schools' GCSE results in several subjects can be explained by changes in cohorts between years. Although these cohort-level outcomes are heavily relied upon for government accountability measures, teachers seemed far from surprised by our findings, suggesting that this was something they already knew.
We therefore wondered whether teachers already had a good idea of how students might tend to perform on exams, and as a result, how one class might differ from
It seems teachers were already well aware of these effects.
another. In previous years (through 2014) teachers routinely submitted a forecast grade for each student before exams were taken.
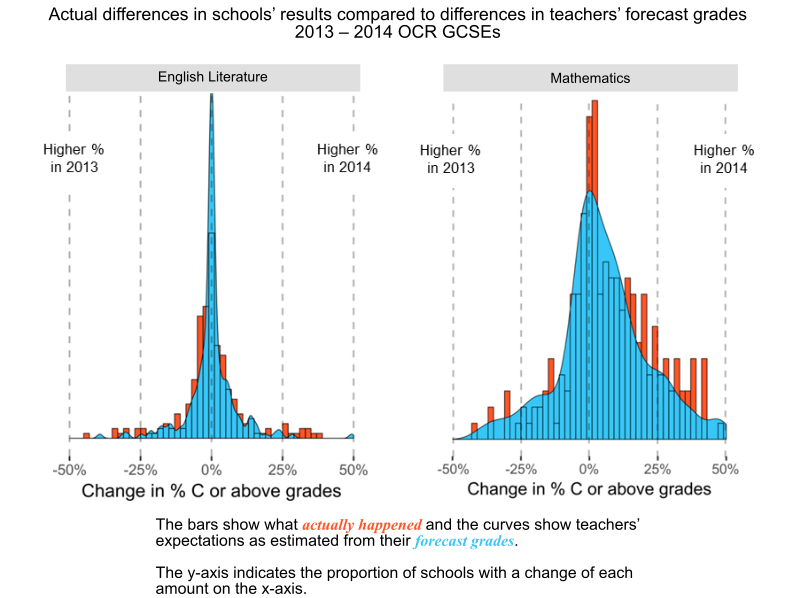
Previous research has shown that these forecasts are not particularly accurate for individual students (making predictions ahead of the exams is hard) but they may still effectively predict fluctuations in results for larger groups. Using these forecasts we calculated how much volatility the teachers themselves expected between 2013 and 2014 cohorts. These calculations involved 220 schools entering at least 10 students in OCR’s English Literature GCSE in both of these years, and 233 schools entering at least 10 students in OCR's Mathematics GCSE during these same years. We then created a histogram for each subject that shows the distribution of actual changes in the percentage of
While predicting students' grades is difficult, explaining volatility might be an easier art.
C or above grades for these subjects between the two years. Higher bars indicate more schools with a change of each size. Finally, we plotted density curves on top of each histogram that showed teachers' predictions about the change in proportion of A*-C grades based on their forecasted grades. It seems that in both subjects, the volatility predicted by teachers was closely aligned with actual changes.
Thus, even if those interested in accountability via test scores were surprised to find that normal changes in students explained most of the observed changes in schools' results, it seems that teachers were already well aware of these effects. So while predicting individual students' grades is difficult, particularly at a time of change in the exam system, explaining volatility might be an easier art.
Cara Crawford
Research Officer, Cambridge Assessment
Join the conversation using #VolatilityHappens Related materials