07 April 2017

Volatility in schools’ GCSE exam results is normal, quantifiable and predictable, researchers from Cambridge Assessment argue in a report out today, published just before the major teaching union conferences in England.
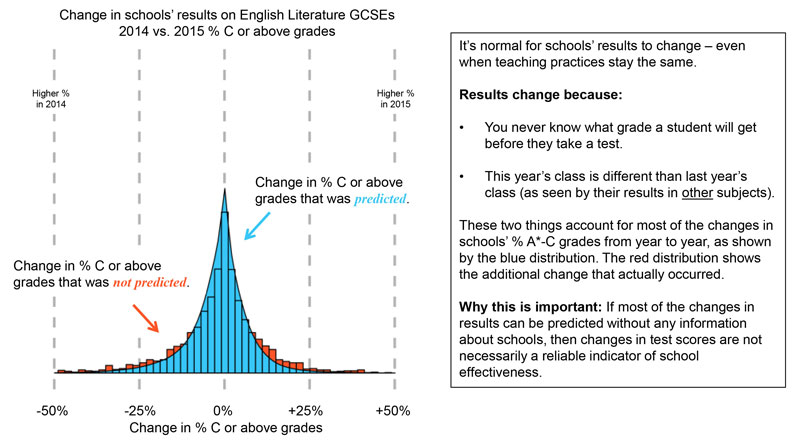
Cara Crawford and Tom Benton say that fluctuations are to be expected and can be largely explained by a change in the students or even just simple chance. They say that although it might be seen as obvious, in some years pupils will perform better than expected, while in other years pupils will perform worse. For example, based on measureable changes in cohorts, one in five schools were expected to have large changes in their % A*-C English Literature GCSE results between 2014 and 2015. Only slightly more than this actually did.
The researchers say the study, Volatility happens: Understanding variation in schools’ GCSE results, will enable schools to manage expectations and mean heads and governors can interpret changes in performance appropriately. The research builds on an earlier study that ruled out exam grade boundaries and marking as major components of volatility. The current research adds an understanding of just how much volatility can be accounted for by the routine changes in students between years and normal variations in individual students’ performance in a particular exam.
“Volatility happens, and it happens because students are not machines that can precisely access the same information from memory every single time it is required,” the researchers say.
“It happens also because each year different students enter Year 11 at each school and therefore they are not identical to the group of students that sat for the previous year’s GCSEs at that school”.
In their study, the researchers used data about GCSE performance between 2011 and 2015 from the Department for Education’s National Pupil Database. They then used statistical models to estimate how much of the national variation in students’ results was explained by differences between schools, differences between years (cohorts) at the same schools, and finally, by differences between pupils within a cohort. Once students’ typical academic performance was added into their models, the size of predicted fluctuations was very nearly as large as those seen in practice – proving that the majority of volatility can be explained by normal variation in students’ abilities. The researchers say the approach used in the report could be used by schools to better understand the range of students’ performance which might occur.
“Because there is chance involved, and because schools and their students change over time, it is natural that schools would see different results from one year to the next,” the researchers conclude.
“The most important thing is that as a teacher you don’t know what mix of abilities you’ll get in a particular class each year. Recognising this ensures we have realistic expectations of our education and assessment system.
“It’s normal for schools’ results to change – even when teaching practices stay the same.”
Join the conversation using #VolatilityHappens
Related materials